The importance of p-values in data analysis cannot be overstated, as they serve as a cornerstone in statistical hypothesis testing. In the world of research and data-driven decisions, understanding the interpretation of p-values is crucial for accurately assessing the strength of evidence against a null hypothesis. This formal exposition aims to elucidate the concept of p-values in the context of statistical analysis and provide a comprehensive guide to their interpretation and application.
Read Now : Large-scale Data Fusion Practices
Understanding P-Values in Statistical Analysis
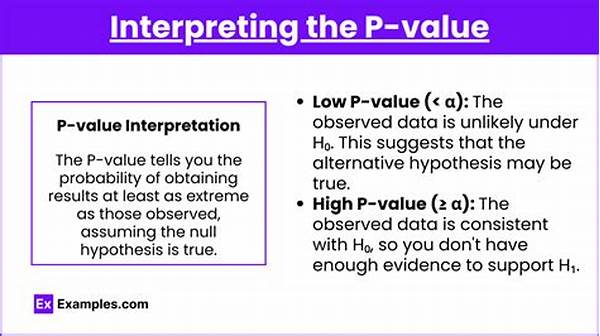
The p-value is a fundamental concept in statistical analysis that quantifies the strength of evidence in hypothesis testing. Essentially, it represents the probability of obtaining observed, or more extreme, results assuming the null hypothesis is true. This interpretation guides analysts in determining whether to reject or fail to reject the null hypothesis. A low p-value, typically less than a significance level of 0.05, suggests strong evidence against the null hypothesis, prompting researchers to reject it. Conversely, a high p-value indicates insufficient evidence, leading to the retention of the null hypothesis. Effective p-value interpretation in data analysis requires a nuanced understanding, acknowledging that p-values do not measure the probability that the null hypothesis is true, nor do they quantify the effect size.
Recognizing the context in which p-values are applied is integral to their interpretation. Different fields may adopt varying significance levels due to differing standards of evidence. Moreover, p-values are influenced by sample size; large samples may yield small p-values even with negligible effect size, while small samples might fail to demonstrate significance. Thus, p-value interpretation in data analysis should always be accompanied by a consideration of the experimental design, sample size, and context-specific standards.
Despite their utility, p-values are often misunderstood or misused. Common misconceptions include interpretations of p-values as a measure of the probability that the null hypothesis is true or false, confusion between statistical and practical significance, and the overemphasis on arbitrary significance thresholds. To foster rigorous p-value interpretation in data analysis, researchers must exercise caution, considering the limitations and complementing p-values with other statistical measures like confidence intervals and effect sizes.
Key Aspects of P-Value Interpretation
1. Probability of Observing Data: A p-value indicates the probability of observing the data, or more extreme results, under the assumption that the null hypothesis is correct. P-value interpretation in data analysis hinges upon this probability assessment.
2. Significance Thresholds: Typically set at 0.05, significance thresholds inform whether a p-value signals strong evidence against the null hypothesis. However, strict adherence to these thresholds can oversimplify p-value interpretation in data analysis.
3. Sample Size Consideration: Larger sample sizes can result in smaller p-values for small effect sizes, necessitating careful p-value interpretation in data analysis in the context of the sample size used.
4. Limitations of P-Values: Despite their prevalence, p-values have limitations, such as not conveying the size or importance of an effect. Understanding these limitations is crucial in p-value interpretation in data analysis.
5. Complementary Statistical Measures: P-values should be considered alongside confidence intervals and effect sizes. This triangulation approach enhances the robustness of p-value interpretation in data analysis.
Challenges in P-Value Interpretation
Misinterpretations of p-values remain prevalent in statistical practices, underscoring the need for rigorous analytical standards. One common pitfall is equating p-values with the probability that the null hypothesis is true. This misunderstanding can lead to erroneous conclusions about the data. Additionally, the exclusive reliance on p-values disregards the importance of effect size and its practical implications. Hence, p-value interpretation in data analysis should be integrative, combining other statistical measures for a holistic view.
Another challenge arises with the arbitrary application of a 0.05 significance level across diverse disciplines. What constitutes significance in one field may not ascribe to the same threshold in another. This necessitates a contextual adaptation of significance levels, further complicating p-value interpretation in data analysis. Researchers need to contextualize p-values, revisiting assumptions and adjusting significance thresholds as per field-specific criteria and study design.
Despite these challenges, effective p-value interpretation in data analysis remains critical in scientific inquiry and decision-making processes. It commands a careful balance between statistical evidence and substantive interpretation. Therefore, it is paramount for researchers to attain a comprehensive understanding of p-values and employ them judiciously, steering clear of misinterpretations and acknowledging their limitations and applications.
Misconceptions About P-Values
1. P-Value as Probability of Hypothesis: One widespread misconception is treating the p-value as the probability that the null hypothesis is true or false. Correct p-value interpretation in data analysis emphasizes that it reflects the probability of data, not hypotheses.
2. Arbitrary Thresholds: Another misconception involves rigid adherence to an arbitrary threshold, such as 0.05. This oversimplifies p-value interpretation in data analysis, dismissing the nuanced decision-making process it should entail.
3. Significance Equals Practical Importance: Commonly, researchers equate statistical significance signaled by p-values with practical significance, which can lead to misleading p-value interpretation in data analysis.
4. Dependence on Sample Size: Larger samples naturally yield smaller p-values, sometimes irrespective of meaningful effects, highlighting the necessity for cautious p-value interpretation in data analysis.
5. Indication of Effect Size: A frequent error is interpreting p-values as indicative of effect size. Accurate p-value interpretation in data analysis requires supplementary measures to ascertain effect magnitude.
Read Now : Harnessing Apis For Better Customer Engagement
6. Reproducibility and P-Values: Misjudgments arise when p-values are expected to ensure reproducibility. P-value interpretation in data analysis should acknowledge that p-values do not guarantee identical results in replication.
7. P-Values and Hypothesis Confirmation: Despite the null hypothesis focus, misunderstandings persist on p-values confirming a hypothesis, requiring careful p-value interpretation in data analysis.
8. Univariate versus Multivariate Contexts: Application differences between univariate and multivariate analyses necessitate distinct p-value interpretation in data analysis strategies.
9. Overemphasis in Decision Making: P-values alone are insufficient for decisions, necessitating a comprehensive p-value interpretation in data analysis alongside broader empirical and theoretical knowledge.
10. Assumptions in Statistical Models: The reliance on stringent model assumptions can mislead p-value interpretation in data analysis, underscoring the importance of careful assumption validation.
Comprehensive Guide to P-Value Interpretation
In providing a practical understanding of p-value interpretation in data analysis, researchers should adhere to a multidimensional approach. Primarily, it involves contextual appreciation, where the field of study defines what constitutes significance. For example, in life sciences, a lower threshold might be necessary given the high stakes decisions. In contrast, exploratory research might permit more lenient thresholds, reflecting the adaptive nature of p-value interpretation in data analysis.
Equally important is the reconciliation of statistical and substantive significance. While a p-value can denote statistical significance, researchers must assess its practical implications by evaluating effect sizes and confidence intervals. This integration enables informed judgements, enhancing the interpretive depth beyond mere statistical significance. Such a comprehensive approach to p-value interpretation in data analysis ensures that analytical findings are robust and actionable in real-world contexts.
Simultaneously, documentation of analysis procedures and transparent reporting of p-value interpretations is essential for replicability and scrutiny. In an era where research reproducibility is questioned, adequately documented p-value interpretation in data analysis serves as a safeguard against ambiguities and fosters greater scientific integrity. The commitment to ongoing education and refinement of analytical skills stands as an indispensable facet of conducting reliable and responsible data analysis, ultimately reinforcing the foundational role of p-values in scientific research.
Practical Implications of P-Value Interpretation
The practical implications of p-value interpretation in data analysis extend beyond theoretical conceptions. In applied settings, p-values guide decision-making processes, underscoring the importance of accurately assessing the evidence against null hypotheses. For example, in clinical trials, where patient well-being is contingent on reliable results, p-value interpretation must be thorough and contextualized within the broader scope of study variables. It aligns the statistical outcomes with real-world applications, bridging the gap between empirical analysis and practical enactment.
Consequently, practitioners must exercise discernment in interpreting p-values, acknowledging their limitations without undermining the value they offer. Misinterpretation can lead to ineffective policies, misguided strategies, or flawed conclusions, underscoring the necessity for a robust analytical foundation. P-value interpretation in data analysis thus represents not only a statistical tool but a critical element of informed decision-making, permeating diverse domains from healthcare to environmental policy formulations.
Ultimately, the role of p-value interpretation transcends quantitative assessment, serving as a gateway to evidence-based practice. In fostering precise interpretation, analysts contribute to the credibility of research findings and the ethical application of statistical insights. As data science continues to evolve, the ability to interpret p-values accurately and responsibly remains a vital skill for analysts and researchers alike, cementing their role as stewards of data integrity and innovation.
Summary of P-Value Interpretation in Data Analysis
In summary, p-value interpretation in data analysis necessitates a discerning approach, adept at distinguishing statistical significance from practical application. While p-values alone offer insights into the probability of observed data under a null hypothesis, their interpretation should be augmented by additional statistical measures such as effect sizes and confidence intervals. This comprehensive evaluative framework strengthens the rigor and reliability of analytical assessments.
Recognizing and addressing common misconceptions about p-values is crucial to effective interpretation. Analysts must avoid the fallacy that p-values alone dictate the validity or truth of a hypothesis, instead considering the broader empirical context. Additionally, the appropriateness of significance thresholds should be tailored to contextual demands, ensuring that p-value interpretation is meaningful within the specific domain of study. Through informed and context-sensitive interpretation, analysts enhance the robustness of data-based conclusions, contributing to the credibility and utility of research outcomes.